
How to Read a Cl v Alpha Polar Plot Chart

All airfoils are designed to generate lift. That’s a given, but did you know that the lift an airfoil can generate can be calculated to better understand it’s overall lift characteristics?
In this article we will take a more lay person's look at how to read a Polar Plot chart of Lift Coefficient. At first glance it may be a little bit intimidating. Rest assured it is very simple to read and understand and will help you decide on airfoils for your future flying model airplanes.
Historically, scratch builders of model airplanes did not rely on sophisticated software when creating their wings. Using well known and simple airfoil templates were the way to go. Now, with CAD software like Solidworks, Fusion 360 and other 3D design tools, we can design and build planes with far more predictable and intended results.
Knowing how airfoils behave will give you, as a designer, greater flexibility in your wing design.
Cl v Lift charts are computer generated or can be manually calculated using an equation. Who really does that these days anyway besides aeronautical students?
The example chart in this article is the lift coefficient of a supercritical airfoil. I have plotted 2 lines on the chart for two. Each line is calculated based on a Reynolds number.
What is a Reynolds Number?
In aviation, a Reynolds Number is calculated using an airfoil’s chord width, the speed at which the airfoil is moving through the air measured in meters per second, and the Kinematic Viscosity of the fluid the airfoil is traveling through. It is used to predict the lift characteristics of an airfoil.
For example: I have a wing root chord of 0.646583 meters, that is traveling through 20 degree air at 25 meters per second. This will result in a Reynolds Number of 1,069,722. Then we can use this to plot the lift coefficient of the airfoil.
It is important for you to calculate the Reynolds Number so that you can produce an accurate chart for your model. Airfoiltools.com has a free simple calculator here that you may use.
Reading the Chart
Looking at the chart we can see that the airfoil when flying around 90kph at 0 degrees angle of attack will generate lift near the 0.48 number which is a lift force per unit span of the wing. Yes, it’s technical, but helpful.
We can also see, as the angle of attack increases so does the lifting force until the AoA reaches 16 degrees, then it falls off. This is the point where this airfoil section of the wing will drastically stop producing lift. Also known as a stall, as laminar flow has become turbulent.
It’s also important to know; If you choose an airfoil with a very sharp drop off at the top of the lift slope, stalls will be far more dramatic. In contrast, an airfoil that has a more gradual drop of at the top of the plotted lift slop will produce a more docile stall.
Trainer airplanes, both full scale and model scale, incorporate airfoils that generate good lift and stall gently. This is something that you should take into consideration when you are choosing airfoils for your models.


In Summary
The plotted slopes on the chart represent a given relative air speed, at a given temperature and how much lift it will produce at various angles of attack. It’s also important to not confuse angle of incidence with angle of attack.
Angle of incidence is a design consideration and you can use this chart to decide on a positive or negative angle of incidence depending on the characteristics you are trying to achieve in flight.
There are several other factors to consider such as drag coefficient but that is another topic that I will cover in another article.
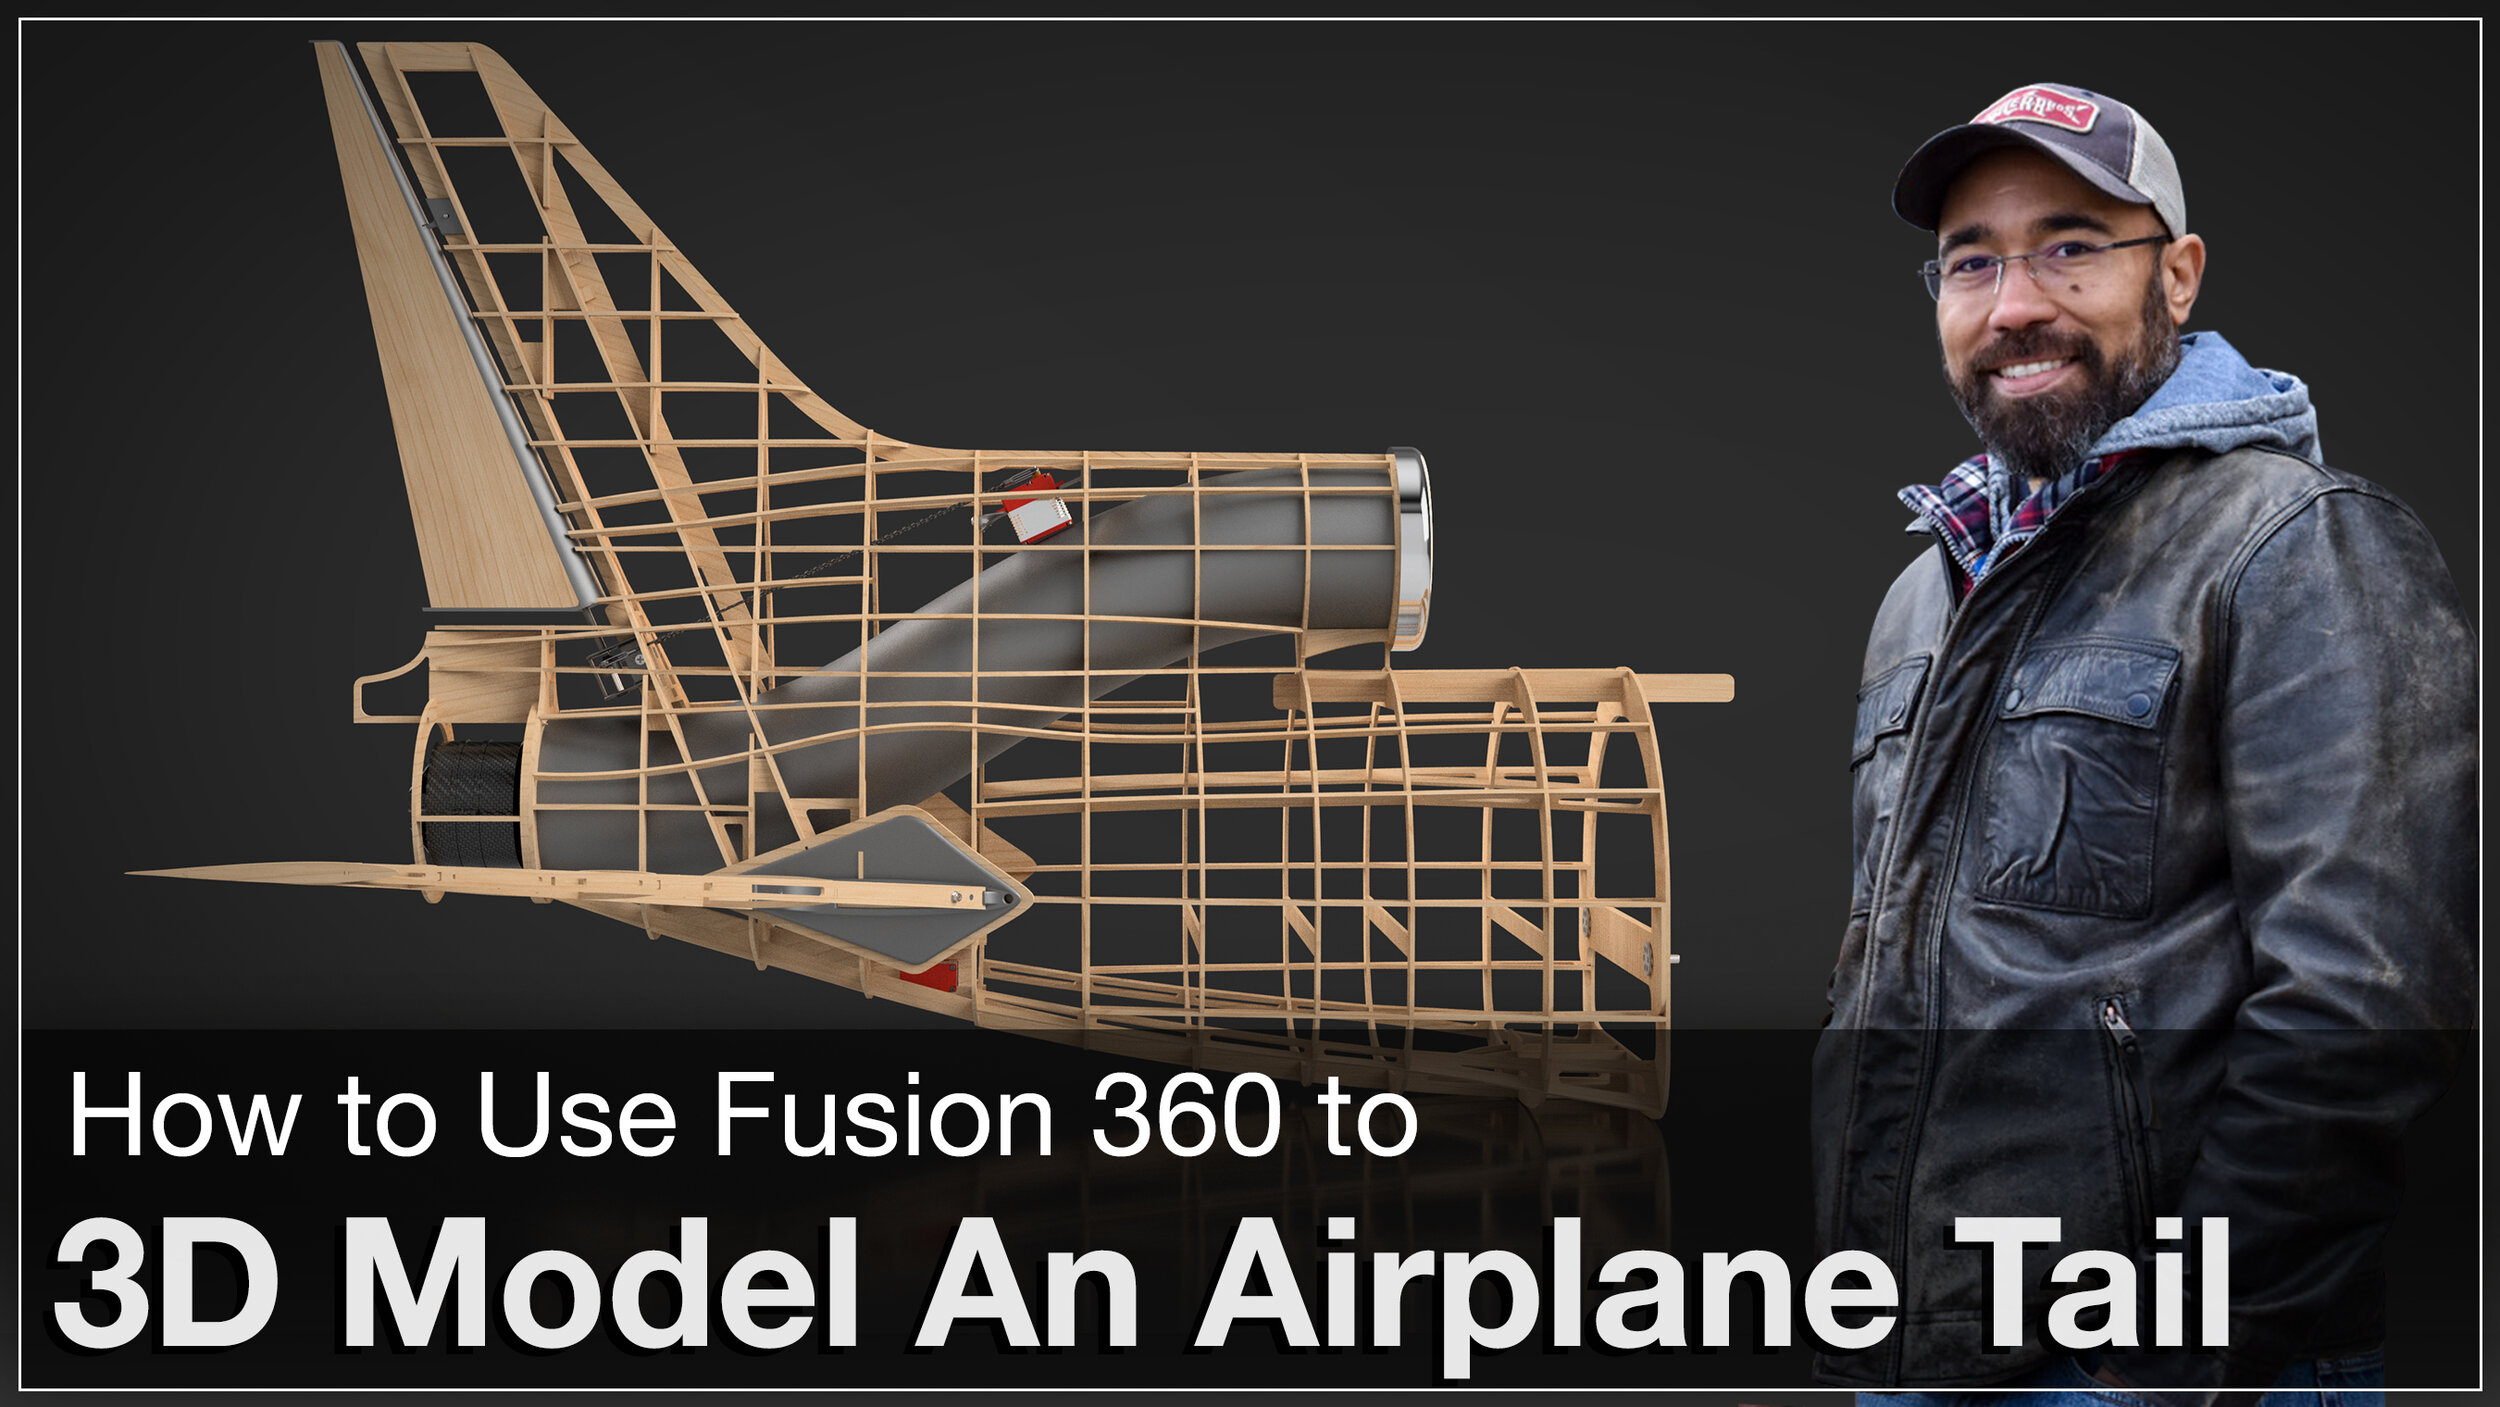
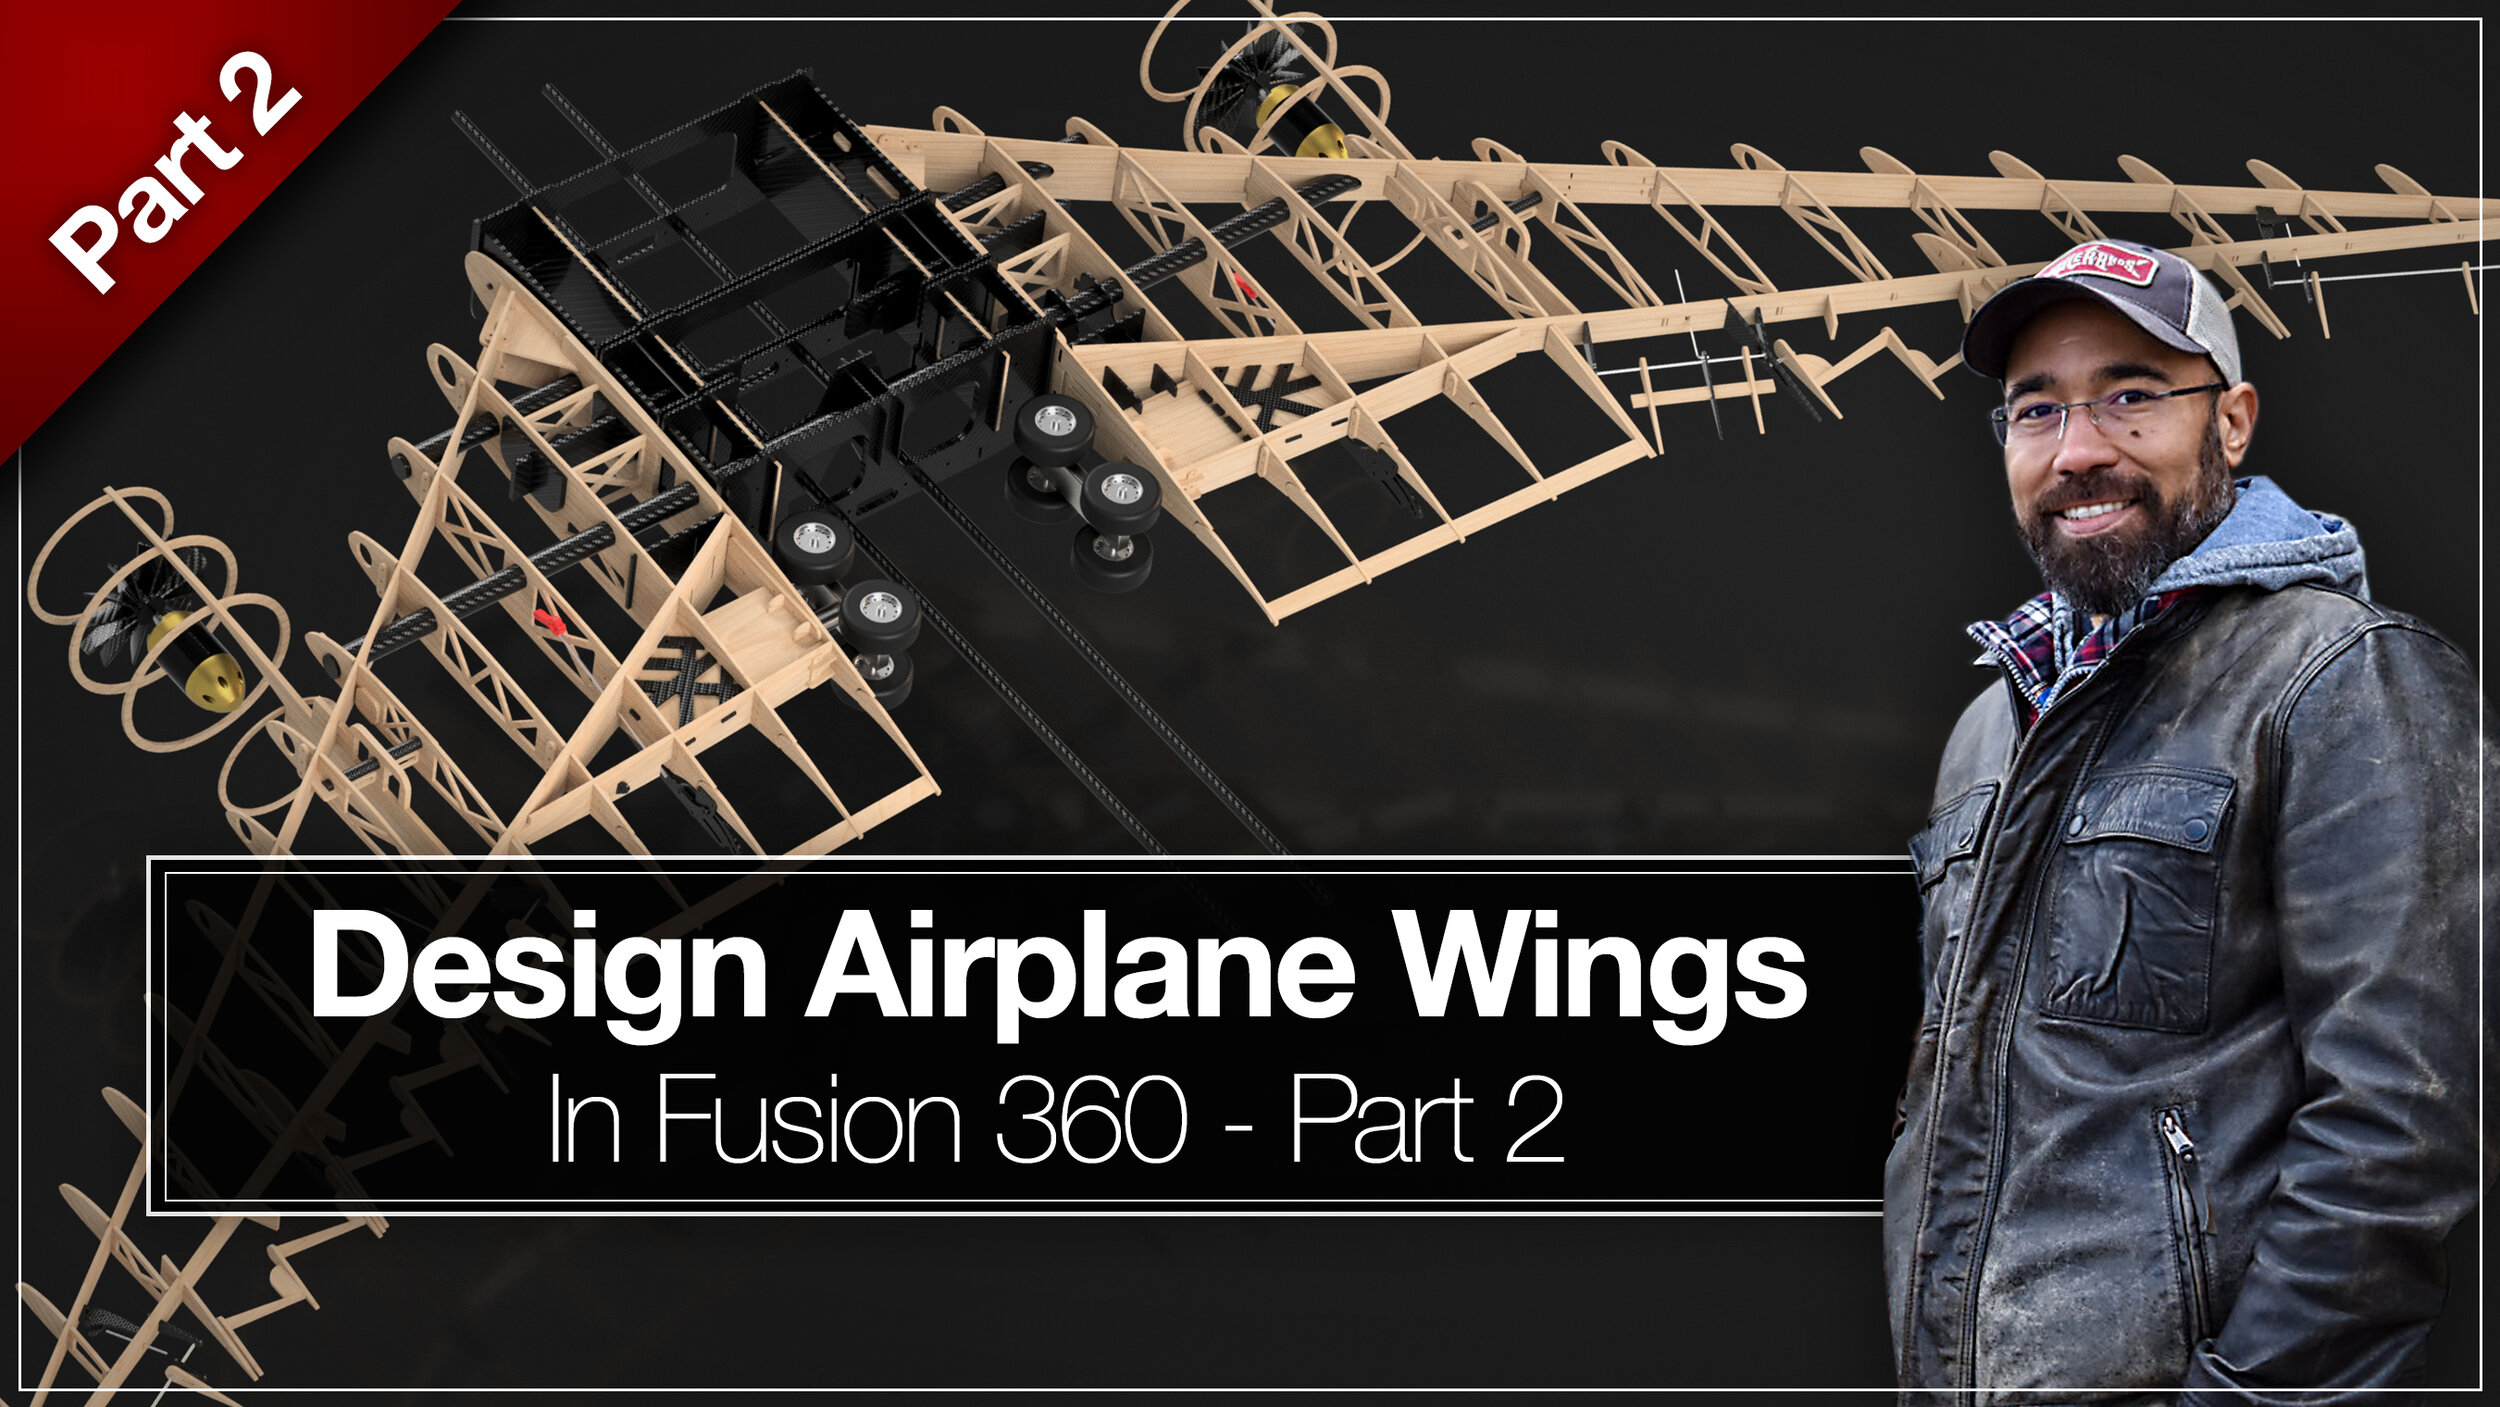
Get Started Designing Wings for your Airplane Models

In this video tutorial, I will show you how to set up the foundations you will need to start designing your airplane wings.
Most Recent Photos and CAD Renderings


Start Designing Your Own RC Airplanes With These YouTube Video Tutorials from RC CAD2Vr


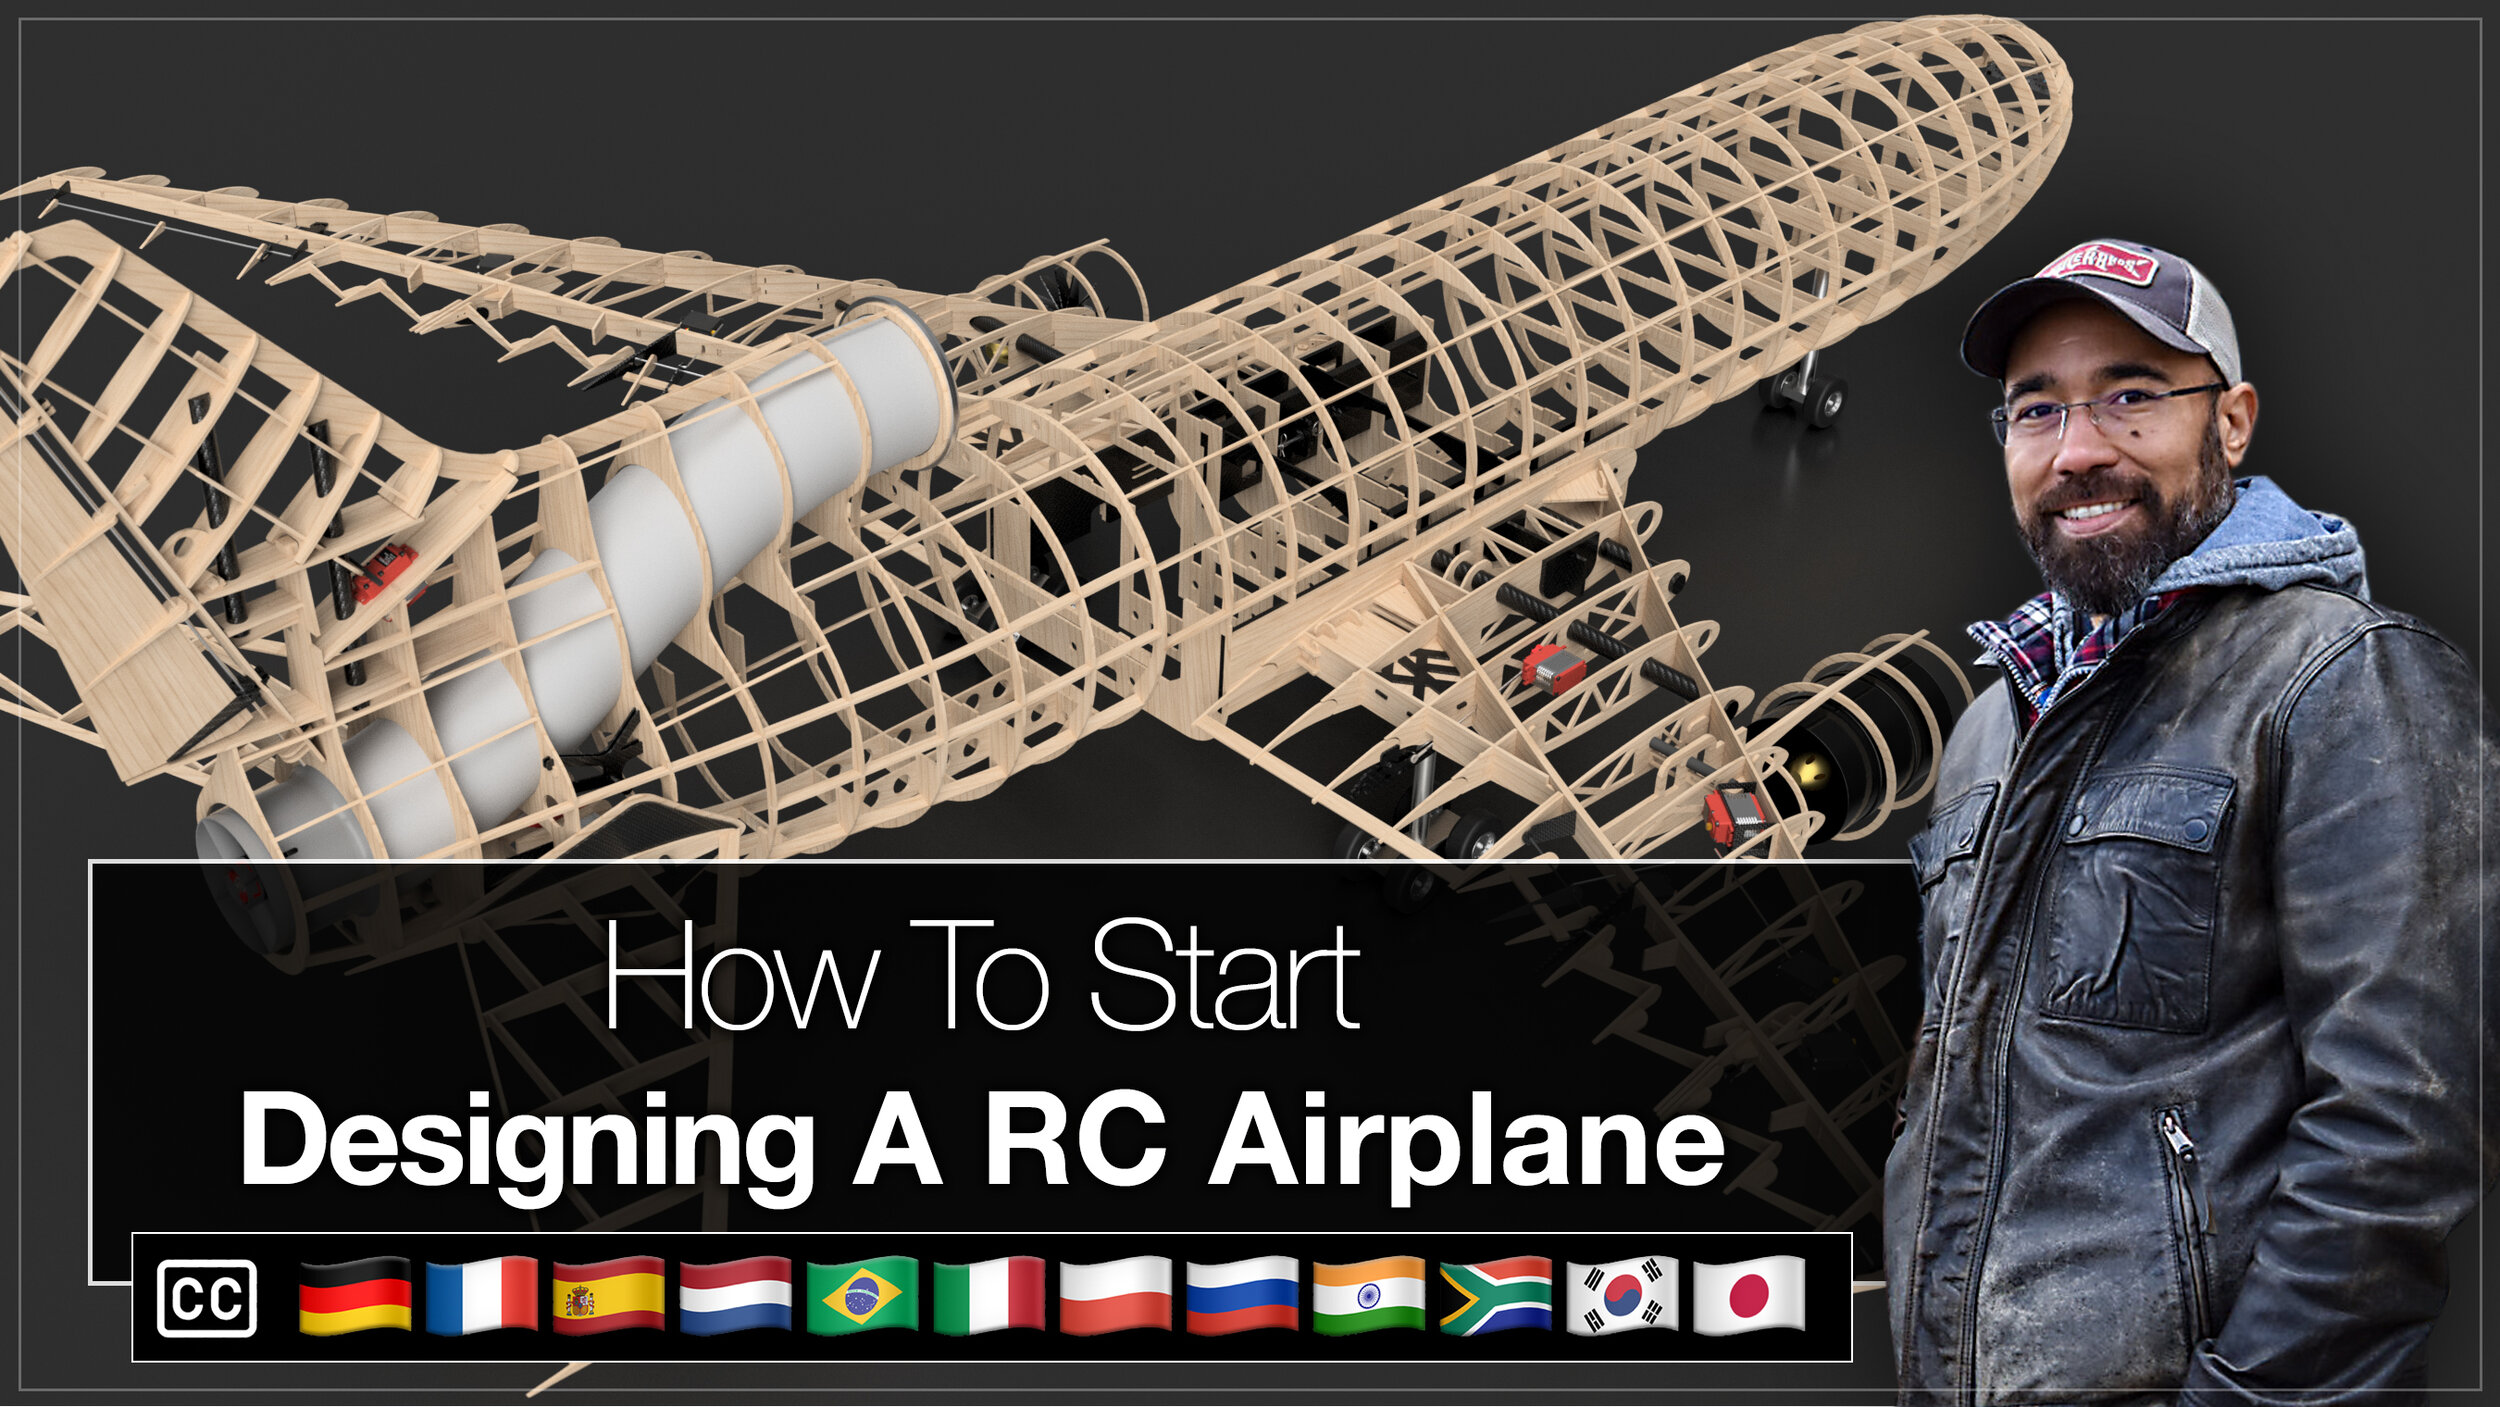
Designing a plane but don't know where to begin with wing design? In this video tutorial I’ll show you how to start designing wings for your RC airplane. Whether you’re building with balsa, 3D printing, or developing foam plans the Fusion 360 concepts are the same.